Hierarchical Traffic Management in O-RAN – A Vehicular Scenario
Introduction
Vehicular communication presents a complex set of challenges within the realm of 5G and future networks, primarily due to its ever-changing temporal and spatial dynamics. This use case places specific and demanding requirements on mobile networks, as it includes a diverse range of services with varying needs. In that context, we address this problem by flexible utilization of both Traffic Management rApp (TM-rApp) and Traffic Steering xApp (TS-xApp), which could help in V2X scenarios [1 – 2]. We also emphasize the use of enrichment information (EI), made available through O-RAN, that specifically suits vehicular services, such as car platoon geolocation or emergency notifications. Such a piece of information may be accessed and collected in various ways – via, e.g., access to dedicated databases, radio environment maps, external servers, etc. Moreover, RAN statistics may be requested and accessed in an authorized way by the external stakeholders via the recently introduced Y1 interface [3]; it is an interface between Near-RT RIC and Y1 consumers, enabling RAN analytics information exposure from Near-RT RIC. We present our approach to the mentioned use cases, through the development of TM-rApp, TS-xApp, and verification of their joint operation in a dedicated V2X simulation scenario. In our implementation, we concentrate on three aspects:
- flexible, policy-based hierarchical traffic management by deploying TM-rApp and TS-xApp in a vehicular scenario;
- efficient usage of EI to better react to and predict the traffic changes in the network;
- exposure of RAN statistics toward registered Y1 consumers.
In this blog post, firstly, we introduce TM-rApp, and TS-xApp, with their placement in the system. Secondly, we describe the simulation setup considered in this scenario. Finally, we present detailed simulation results with conclusions and a summary.
Note: (You can find more about the O-RAN network, its elements, and architecture in this blog post: link. You can find more about RIC, xApps, and rApps in this blog post: link)
TS-xApp (Traffic Steering xApp) and TM-rApp (Traffic Management rApp)
TS-xApp is responsible for broadly understood network traffic steering. Through the TS-xApp it is possible to achieve one of many goals, such as load balancing, where each node of the network is similarly loaded. The goals (or objectives) can be defined by the operators and the xApp can be controlled with the use of policy delivered from the A1 interface. It is also possible to minimize handovers, delays, separation of services, or minimization of energy consumption. TM-rApp controls the operation of TS-xApp by creating appropriate traffic control policies. The simplest traffic management can be illustrated as a situation when there is an emergency in some specific place, and some of the traffic should be offloaded from the cell nearest to the emergency location. It creates an opportunity for reservation of resources for emergency services like ambulances, police, etc. Finally, the network maximizes QoS for critical devices and helps with solving or easing challenging situations. A very important aspect of TM-rApp is the possibility for usage of different sources of data to improve decisions made by traffic management algorithms. Such data sources are not limited to only RAN-specific data, but also some external data can be used, e.g. dedicated databases. Potentially, databases can provide access to data very helpful in the decision-making process considered in V2X use cases, like information about routes of buses, platoons, accident locations, or emergency services locations.
Simulation setup
The solution was evaluated in a scenario with several O-RAN Distributed Units (O-DU) connected to one O-RAN Central Unit (O-CU) in the O-RAN network simulation. These nodes are connected to the Near-RT RIC, which in turn works with the Non-RT RIC. Implementation of TS-xApp and simulated E2 nodes were prepared using the VMware platform (SDK for xApp, and E2Node implementation; instance of distributed RIC). As presented in Fig. 1 – two applications are installed in the considered network:
- TS-xApp – which works as an application on top of the Near-RT RIC and through the E2 interface obtains information about cells and network users. In addition, it receives A3 events, based on which (and the operation of the appropriate traffic control algorithm) it makes decisions about the user’s handover between cells. TS-xApp can apply policies, which are compliant with ORAN_TrafficSteeringPreference_2.0.0 [4].
- TM-rApp – which works as an application inside the Non-RT RIC and observes metrics through the O1 interface, specifically – cell load. Additionally, TM-rApp has access to Enrichment Information about road traffic (accident location, platoon routes, etc.) from external databases. As a result of the implemented algorithm, rApp can generate appropriate traffic control policies and send them to TS-xApp via the A1 interface.

About Traffic Management rApp (TM-rApp)
TM-rApp aims at minimization of handover count for platoon members, ambulances, or other emergency vehicles. At the same time, the QoS requirements shall be fulfilled for the remaining users, and the outage of the whole system minimized. The rApp operates continuously and monitors the performance of the network by analyzing various parameters (e.g., O-DU PRB usage) via the O1 interface. In case of a high (increasing) load in some of the analyzed areas, which corresponds to the accident location, the rApp logic verifies the load of the potential neighboring cells and creates a set of policies that moves some traffic to another cell. Before the information about accidents improves prediction about traffic demand in specific locations and allows traffic to be offloaded before some outage is observed. Similar behavior can be observed for emergency services, where the known location (and destination) of the vehicle is used for freeing up some resources (like reservation) in cells on the planned route.
Joint TM-rApp operation with TS-xApp
In our simulation, we consider a fragment of the heterogeneous network serving pedestrian and vehicular users whose trajectories have been precisely modeled using widely accepted SUMO software [5]. This selection was motivated to keep the high reliability of the simulated environment.
Furthermore, it was assumed here that various traffic types are present, classified based on the rate, delay, and reliability constraints; in particular, we consider the presence of voice (low-rate) and MBB (high-rate) traffic requested by both pedestrian and vehicular users. Moreover, vehicles can communicate by exchanging data in the cellular V2X scheme (network communication variant), thus requesting low-latency services. Finally, we accommodate the high-rate, low-delay, and high-reliability traffic users, which represent the public security or health services (such as police, ambulance, fireman, first responders, etc.).
In the regular case (i.e., noting exceptional from the perspective of wireless network functioning is happening), it is assumed that the TM-rApp and TS-xApp role is to guarantee handover minimization in the case of high-mobility users, as well as minimization of the outage for low-latency traffic users. Appropriate policies are then created to achieve these goals in a variety of typical scenarios, i.e., with low, medium, and high density of users. However, in the exceptional case, the optimization goals for the TM-rApp and TS-xApp are changed.
Besides the reference scenario (i.e., when a number of pedestrian and vehicular users are moving in the simulated area), we investigate the following two simulation variants:
A. Car Platoon case: in this scenario, we assume that the platoon of autonomous cars is traveling along the street; as the platoon is driving autonomously, for safety reasons, it has to have highly-reliable wireless connectivity guaranteed; thus, once the platoon enters the served area, it should always have access to wireless spectrum resources;
B. Emergency case: in this case, a car accident is considered; once a car crash or accident happens on the road, the traffic profile in the analyzed region changes drastically, i.e. the number of high-mobility users reduces significantly due to the traffic jam; many users inside the cars in the traffic jam will start searching for the reason of the stay, or – simplifying – will increase the usage of mobile phones. However, at some point, the public safety car will enter the area; thus, again, similarly to case A, the public safety services and first responders should take precedence in accessing spectrum resources.
Both scenarios have been visualized in the form of the GUI, which consists of the following modules:
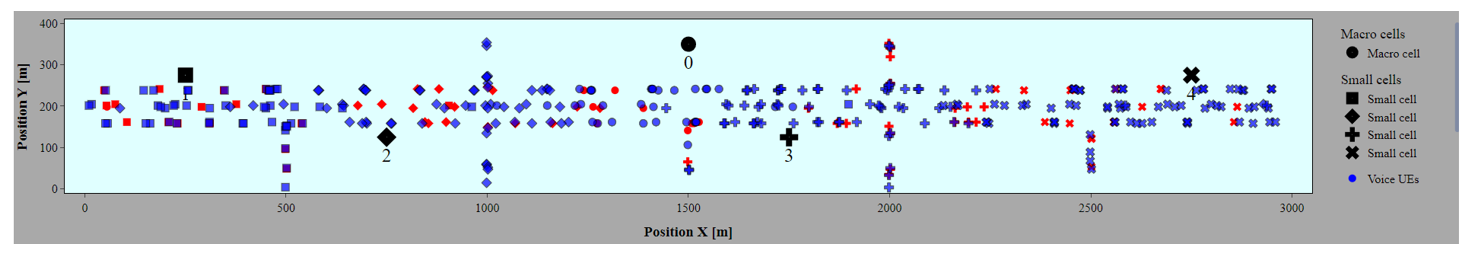
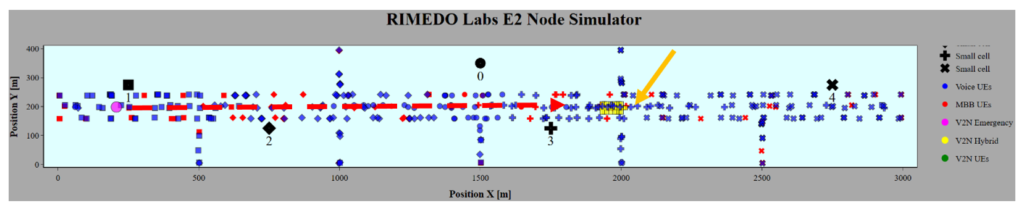
- Road module – in this module the schematic illustration of the roads and the users are shown; the colors represent the types of traffic (such as voice or MBB users); there are five base stations denoted by a big circle (macro base station), and a square, diamond, cross, and x sign; the shape of the end-users represents, which base stations they are associated with.
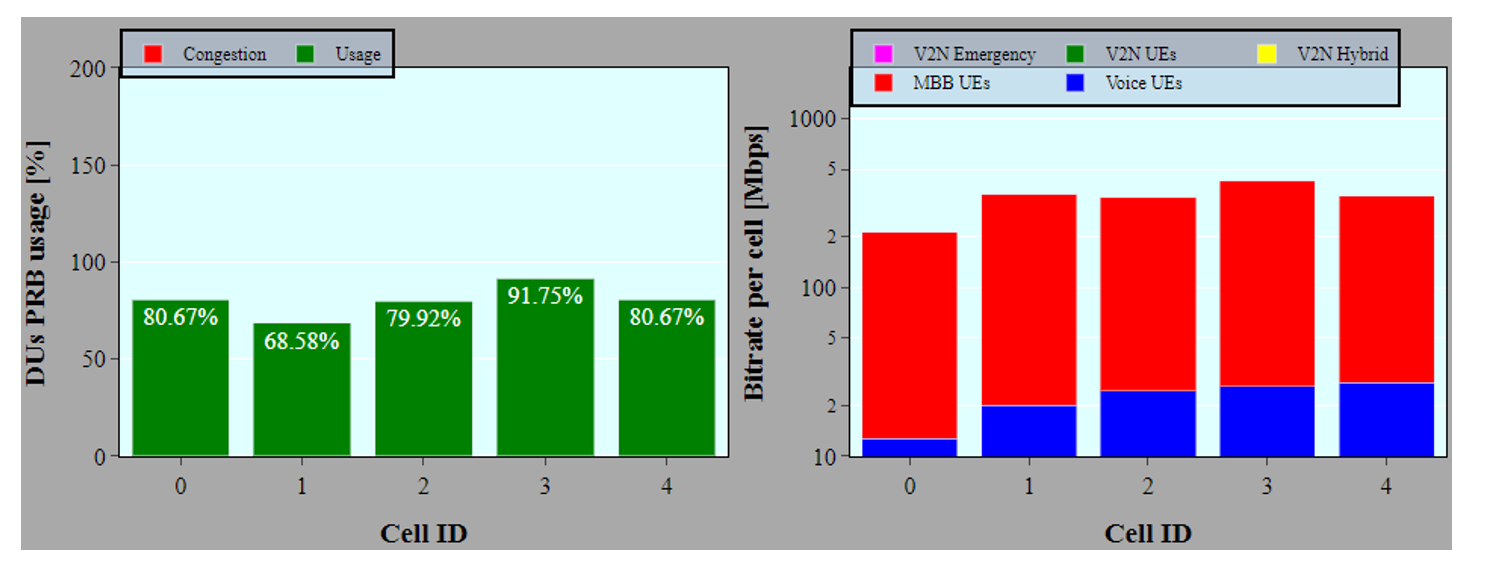
- Performance metric module – in this module one may observe the DUs PRB usage (in percentage per each one of five base stations), as well as the bit rate per cell (split among various classes of traffic); here, the base station of index 0 refers to the macro base station, and base stations of indexes from 1 to 4 – the micro base stations.
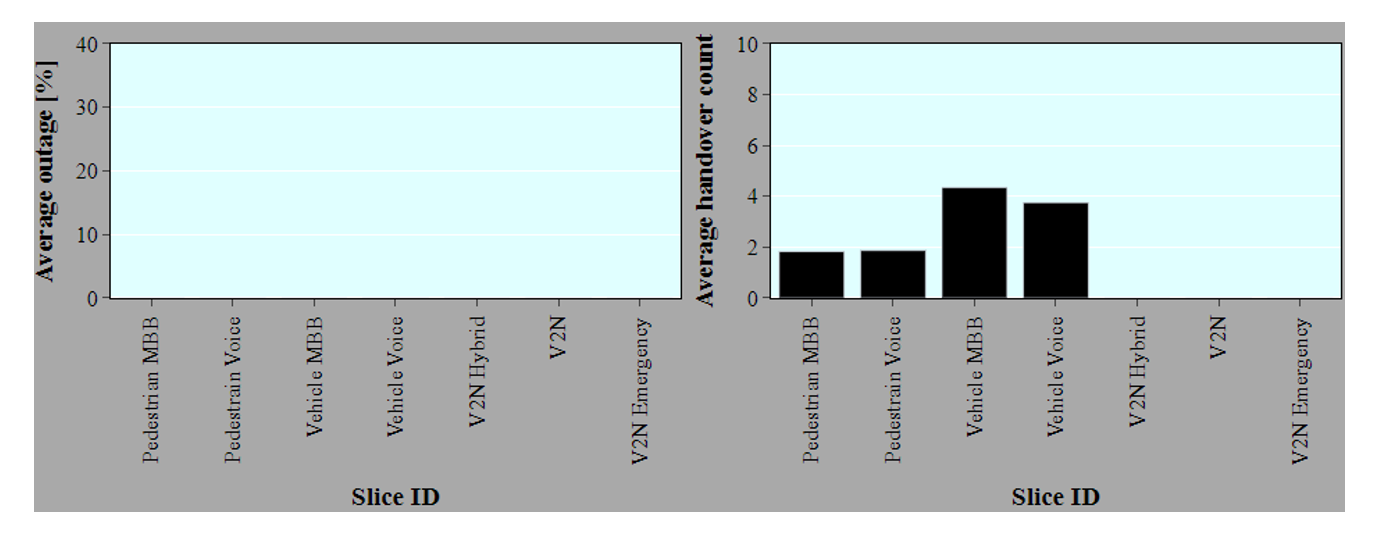
In this module, one can also identify the average outage (in %) as well as the average handover count.
During the simulation, one can observe the real-time change in all the performance parameters. All the users have been moving following the trajectories defined within the SUMO environment. The instantaneous values of the monitored parameters have been presented within the modules mentioned above modules. Moreover, a dedicated plot has been prepared (which represents the parameters potentially exposed via the Y1 interface).
Platoon scenario
An example of a platoon’s route (5 vehicles) can be observed in Fig. 5, where five green marks represent platoon members and their route from left to right of the analyzed area.

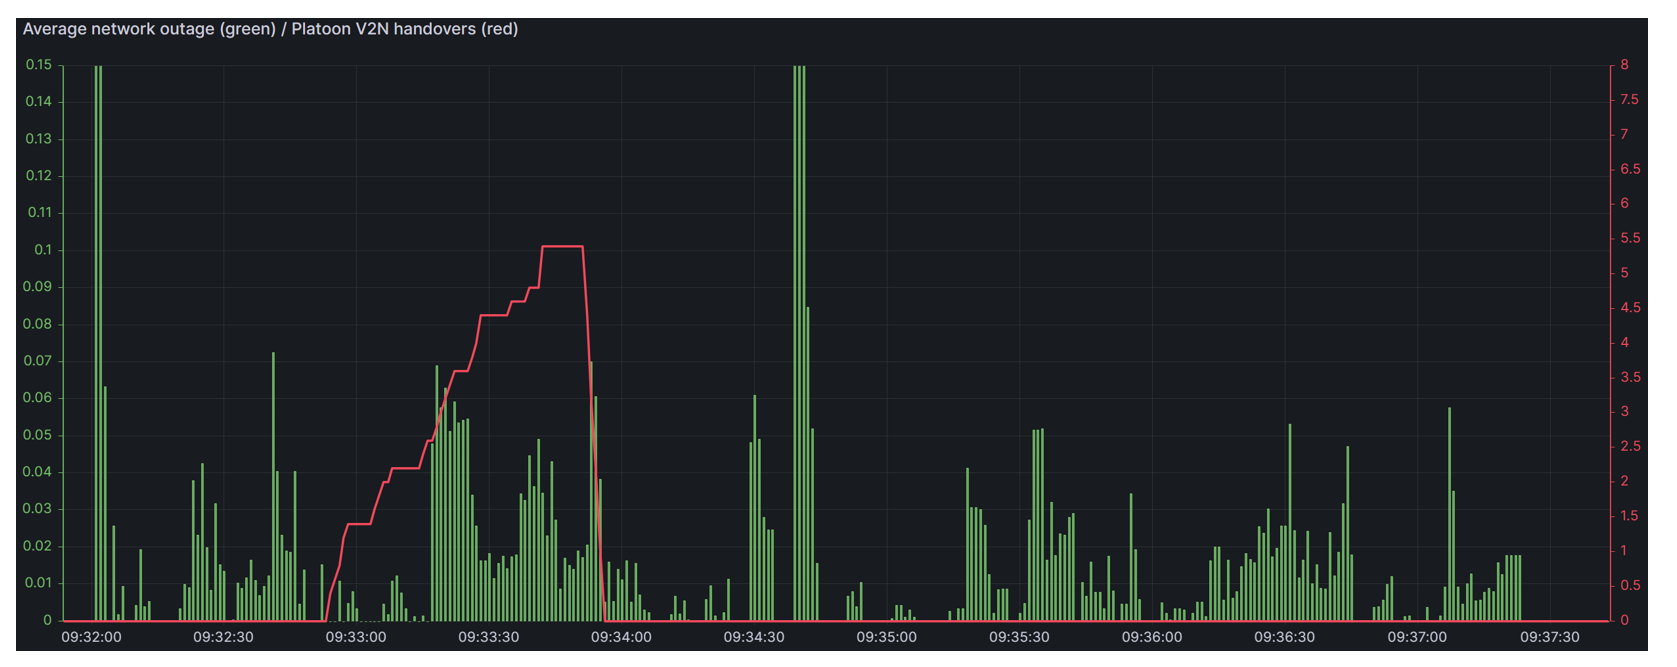
In Fig. 6 a reference scenario (without Traffic Management-rApp influence on the system) could be observed between timestamps 09:32-09:34, where the average number of handovers for platoon members increases with platoon movement along the analyzed road and reaches around 5 handovers (as 5 base stations were in the simulated area). In the meantime, the average network outage oscillates at around 3-7% (initial high outage values – near timestamps 09:32 and 09:34:30 are caused by simulation restart, and its initial states – and should be ignored). TM-rApp reaction on platoon approaching the analyzed area (application of the proper policy for xApp) could be observed between timestamps 09:35-09:38. Here, the average number of handovers is equal to zero – as the initial association of UEs are to a macro cell and remains unchanged the whole time when the platoon is in the analyzed area. At the same time, the average outage of the network is slightly lower and oscillates at around 2-6%. To sum up – the results presented in Fig. 6 show the change in the number of handovers for the platoon members, as well as in the average network outage; one can conclude that by providing customized policies, the performance of the whole network is improved; moreover, the access to EI further improves the performance, as it allows for proactive policy definition. Examples of the logs produced during TM-rApp operation are presented in Fig. 7.

Emergency scenario
In this scenario, once a car accident happened, after some time, an ambulance entered the area. The idea of an emergency car route can be found in Fig. 8, where the emergency car just appeared (from the left side) marked as a pink circle and will travel to the right (red dashed arrow), stop near the accident location (dark yellow arrow), and after some time go further to the right.
In Fig. 9. in the reference case (without TM-rApp available in the system), the total number of handovers for the ambulance (the solid red line between timestamps 16:29-16:32), as well as the observed system outage (green bars), were high, i.e. up to six handovers and up to ten percent of the outage. However, the overall network performance may be higher when the TM-rApp takes action and creates policy (deployed in advance). The rApp takes action and creates policy (deployed in advance), the overall network performance may be higher. Here, we can observe (timestamps between 16:32-16:37) a constant number of handovers (red line) in time (initial values are specific to random behavior of the E2 Node simulator and should be ignored – as a typical case in the simulation process). Additionally, the average load in the network (green bars) is lower, i.e. up to five percent. Moreover, an example of logs produced by TM-rApp during the simulation is presented in Fig. 10.


Conclusions
Analyzed cases show that providing access to rich EI for Traffic Management-rApp improves the management of network resources. Applying TM-rApp and enforcing policies created by rApp offloads some of the traffic from high-demand areas (traffic jams near accident locations) to neighboring cells. Such accident leads to increased outages in the network, and TM-rApp influences indirectly (through A1 policies) a UEs to Cell association function. Such behavior should help even more to reduce outages in the presented (simulated) situation and prevent significant QoS loss observed by users. Additional benefits can be achieved by exposure to high-level network statistics through the Y1 interface. Such information could be further used by service providers that can adapt their service quality to current situations (e.g. by temporarily lowering the quality of video transmission or image resolution). Network statistics that may be exposed for this purpose are e.g. average network outage. Results of this simulation were presented during the O-RAN Global PlugFest event [6] and during the VMware TECHCOnnect event [7].
An important feature, that is worth emphasizing, is TS-xApp flexibility as described in this blog post results in traffic management were possible thanks to cooperation between TM-rApp and TS-xApp (through A1 policies). However, the same TS-xApp without any modification can be successfully used in different use cases, e.g., an energy-saving scenario where ES-rApp cooperates with TS-xApp (see this blog post [11]). TS-xApp thus can be used to achieve different aims in the network, mainly due to the flexibility of traffic steering policy definition. In such cases, per-UE, per-scenario, or per-use-case behavior fits well to optimize the network while using various KPIs, or optimization goals (like maximization of performance, maximization of energy efficiency, or minimization of handovers). More information about TS-xApp can be found in other blog posts:
- O-RAN Use Cases: Traffic Steering [8]
- xApp Implementation: O-RAN Traffic Steering Use Case [9]
- Policy-based Traffic Steering xApp implementation within O-RAN [10]
- Energy Saving-rApp control over Traffic Steering-xApp [11]
You can watch the technical video demonstrating this use case here: O-RAN Hierarchical Traffic Management (TM-rApp and TS-xApp) in Advanced Vehicular Scenarios (Demo) (youtube.com)
References
[1] Traffic Management for V2X use cases in O-RAN; https://rimedolabs.com/blog/traffic-management-for-v2x-use-cases-in-o-ran/
[2] O-RAN ALLIANCE WG1, „Use Cases Detailed Description, v.12.00,” O-RAN ALLIANCE, Tech. Rep., Oct. 2023
[3] O-RAN ALLIANCE WG1, „O-RAN Architecture Description, v.10.00,” O-RAN ALLIANCE, Tech. Rep., Oct. 2023
[4] O-RAN ALLIANCE WG2, “A1 interface: Type Definitions, v.02.00,” O-RAN ALLIANCE, Tech. Rep., Jul 2021
[5] Eclipse, „SUMO – Simulation of Urban MObility”, https://eclipse.dev/sumo/
[6] O-RAN Global PlugFest Spring 2023; https://plugfestvirtualshowcase.o-ran.org/2023/O-RAN_Global_PlugFest_hosted_by_Deutsche_Telekom_EANTC_EURECOM_Orange_Vodafone
[7] Use Cases in the Spotlight: TECHCOnnect Innovation Showcase Brings Monetization, Optimization, and Efficiencies to the Forefront; https://blogs.vmware.com/telco/techconnect-innovation-showcase/
[8] O-RAN Use Cases: Traffic Steering; https://rimedolabs.com/blog/o-ran-use-cases-traffic-steering/
[9] xApp Implementation: O-RAN Traffic Steering Use Case; https://rimedolabs.com/blog/xapp-implementation-o-ran-traffic-steering-use-case/
[10] Policy-based Traffic Steering xApp implementation within O-RAN; https://rimedolabs.com/blog/policy-based-traffic-steering-xapp-implementation-within-o-ran/
[11] Energy Saving-rApp control over Traffic Steering-xApp; https://rimedolabs.com/blog/es-rapp-control-over-ts-xapp-in-oran/
Related Rimedo Labs Resources
- The O-RAN Whitepaper: Sign up for our newsletter to download: The O-RAN Whitepaper
- Blog post on green communications: Green Communication and Computing for 2030 – RIMEDO Labs
- O-RAN Blog posts: Other blog posts regarding the O-RAN: 1. Introduction to O-RAN: Concept and Entities, 2. O-RAN Architecture, Nodes, and Interfaces, 3. near-Real-Time RIC (RAN Intelligent Controller), 4. O-RAN Use Cases: Traffic Steering
- O-RAN website: Find out more about our O-RAN offering, services and materials O-RAN
- Webinar: A video recording from a webinar discussing O-RAN architecture, RIC internals, use cases, with a special focus on traffic steering: O-RAN Architecture and Use Cases – YouTube
- Training: Sign up for our O-RAN System Training (intelefy.com)
Author Bio
Łukasz Kułacz received a Ph.D. in telecommunications from Poznan University of Technology in 2022. He is employed as a research and teaching assistant at PUT’s Institute of Radiocommunications, Poland, and he is an R&D Expert at Rimedo Labs. He is involved in both, national and international research projects. His research interests include the software-defined radio and utilization of context information for radio network operation improvement, in particular in the radio resource allocation process improvement. His scientific works are already published in well-recognized international journals like IEEE Access, IEEE Vehicular Magazine, and MDPI Sensors. At Rimedo Labs he leads the R&D team developing xApps/rApps and realizing dedicated software and simulations for the company’s customers.